Growth · Part of Reporting & Analytics
Executive dashboard
sub-spec 33B
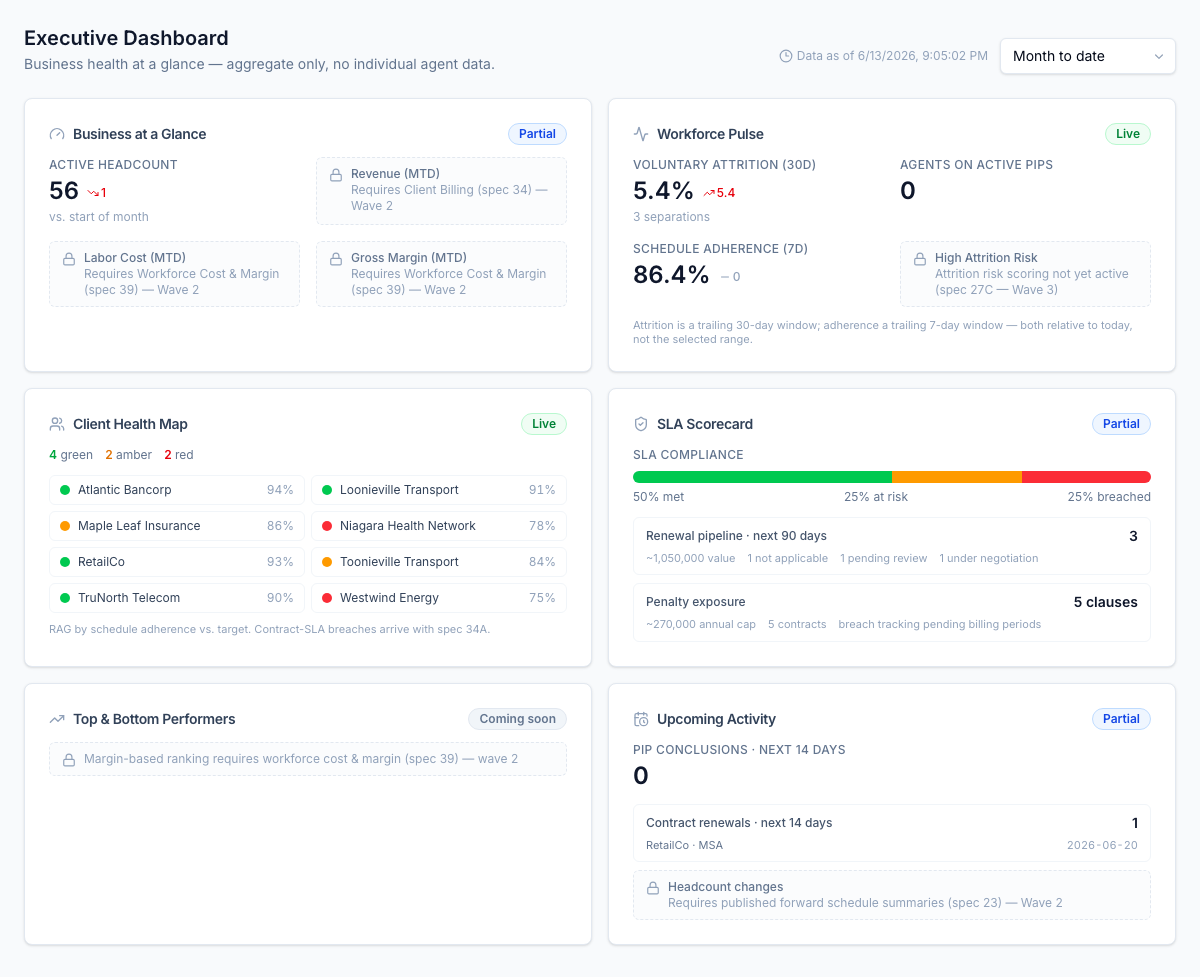
A boardroom business-health view for the CEO, COO, and CFO — revenue, labour cost and margin, a client-health RAG map, top and bottom performers, a workforce pulse, and SLA exposure — aggregate-only, no agent identities.
For the operator
A COO opens the executive dashboard, sees three clients flagged amber on SLA and one team trending down on adherence, and never drills past the tile — the numbers are aggregate, so it's a board-safe view she can screen-share without exposing anyone's personal performance.
Business impact
The people who sign the contracts get one screen that says whether the business is healthy, without waiting on a finance deck. It's aggregate-only by design, so it's safe in front of a board or an investor, and the RAG map turns 'which client is about to churn' into something you see before the QBR, not after.