Growth · Part of Reporting & Analytics
Pre-built operational dashboards
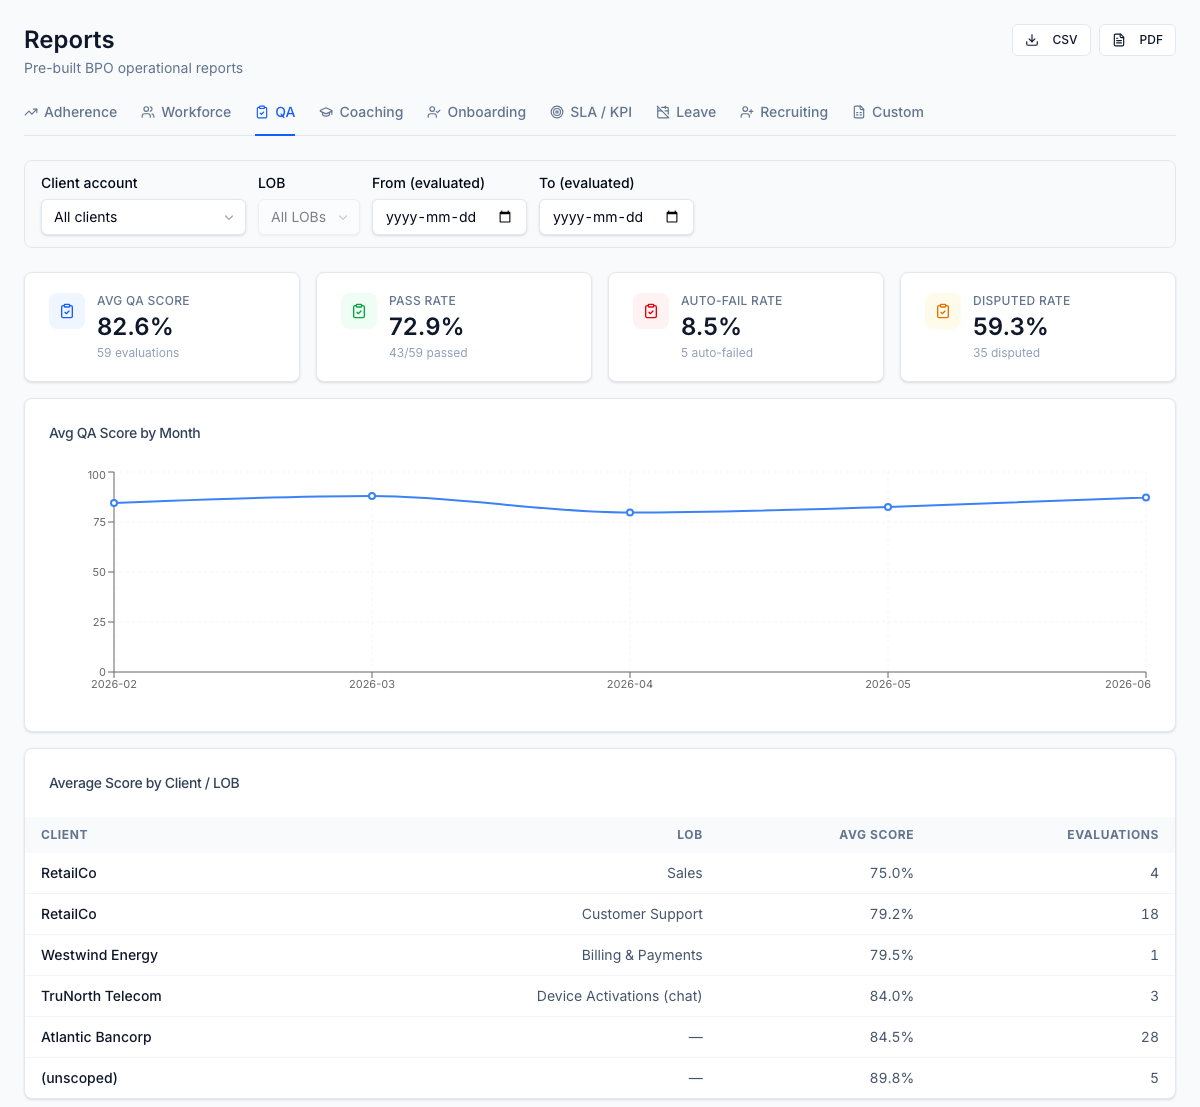
Fixed-metric dashboards for the teams that run a contact centre — Workforce, QA (Quality Assurance: the program that scores and reviews agent interactions.), Recruiting, Coaching, Onboarding, and SLA (Service Level Agreement: a contractual performance target, e.g. answering X% of calls within Y seconds.)/KPI — each filterable by date range, client, and line of business.
For the operator
A WFM (Workforce Management: forecasting, scheduling, and adherence.) lead opens the Workforce dashboard, filters to one client's French LOB (Line of Business: a distinct client program or queue within an operation.) for last week, and exports the staffing-versus-adherence view as a PDF for the client review — no dumping to a spreadsheet and rebuilding the chart by hand.
Business impact
The numbers a contact centre reviews every morning are one filter away and always scoped correctly. Managers stop rebuilding the same pivot tables, and nobody accidentally shows one client another client's data.