Growth · Part of CSAT
Internal CSAT dashboard
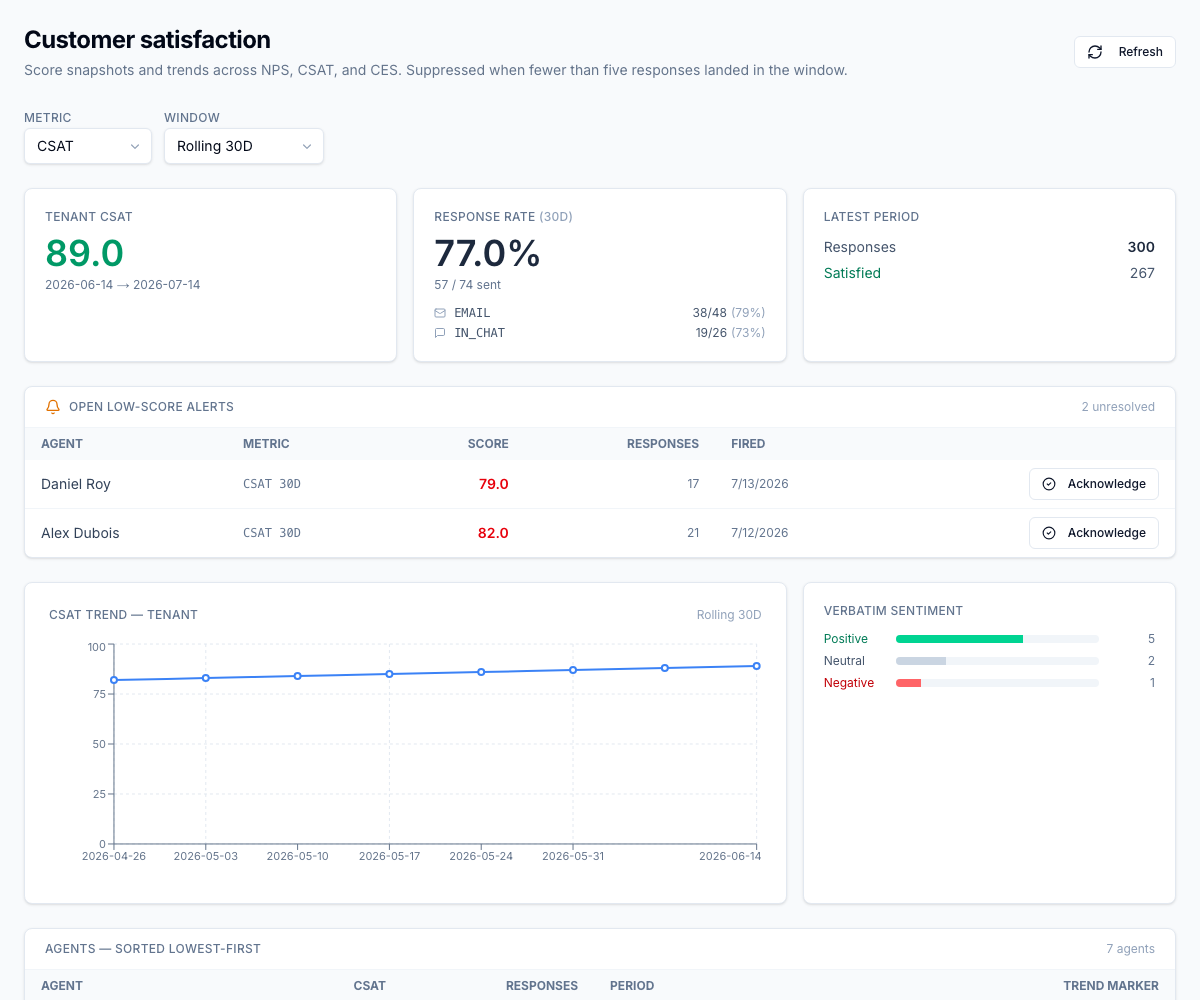
The internal CSAT (Customer Satisfaction: a post-interaction score for how satisfied a customer was.) dashboard at /csat brings voice-of-customer for your whole operation onto one screen. You pick a metric (CSAT, NPS (Net Promoter Score: how likely a customer is to recommend the brand.), or CES) and a rolling window of 7, 30, or 90 days, and the page renders a tenant-score tile with small-sample suppression, a per-channel response-rate table, a latest-period totals tile, a trend line chart, an open low-score alerts panel, a verbatim-sentiment tile, an agent leaderboard, and a CSAT-by-QA (Quality Assurance: the program that scores and reviews agent interactions.)-score-band tile.
For the operator
You open /csat, choose CSAT, NPS, or CES from the metric selector, and set the rolling window to 7, 30, or 90 days. The tenant-score tile suppresses itself when the sample is too small, so you never coach on noise. The per-channel table splits response rates across email and in-chat, and the latest-period totals tile breaks NPS into promoter, passive, and detractor counts or shows the CSAT satisfied count. When a low score lands it appears in the open-alerts panel, and you acknowledge it inline without leaving the page. The verbatim-sentiment tile rolls up positive, neutral, and negative with the top keywords, and the agent leaderboard sorts lowest-first with trend markers so the agents who need coaching sit at the top. The CSAT-by-QA-score-band tile lets you check whether your QA scores actually track customer satisfaction.
Business impact
For a multi-client contact centre, this replaces a standalone CX survey tool: CSAT, NPS, and CES all live inside the same platform as your QA and agent data, so there is no separate seat licence to fund. The CSAT-by-QA-score-band tile lets you prove to a client that your QA scores actually move customer satisfaction, which is the hardest number to defend in a QBR. Lowest-first leaderboards with trend markers point supervisors straight at the agents who need coaching, before a client escalates. Open low-score alerts turn a bad survey into an acknowledged action instead of a monthly surprise, and small-sample suppression keeps you from reporting numbers you cannot stand behind. One screen of voice-of-customer means less analyst time stitching exports together and more time defending margins and renewals.