Starter · Part of Workforce Management
Demand Forecasting
Forecast required headcount per LOB (Line of Business: a distinct client program or queue within an operation.), per interval, using historical volume and target service level. Drives the schedule directly, so capacity planners stop running the same Excel model month after month.
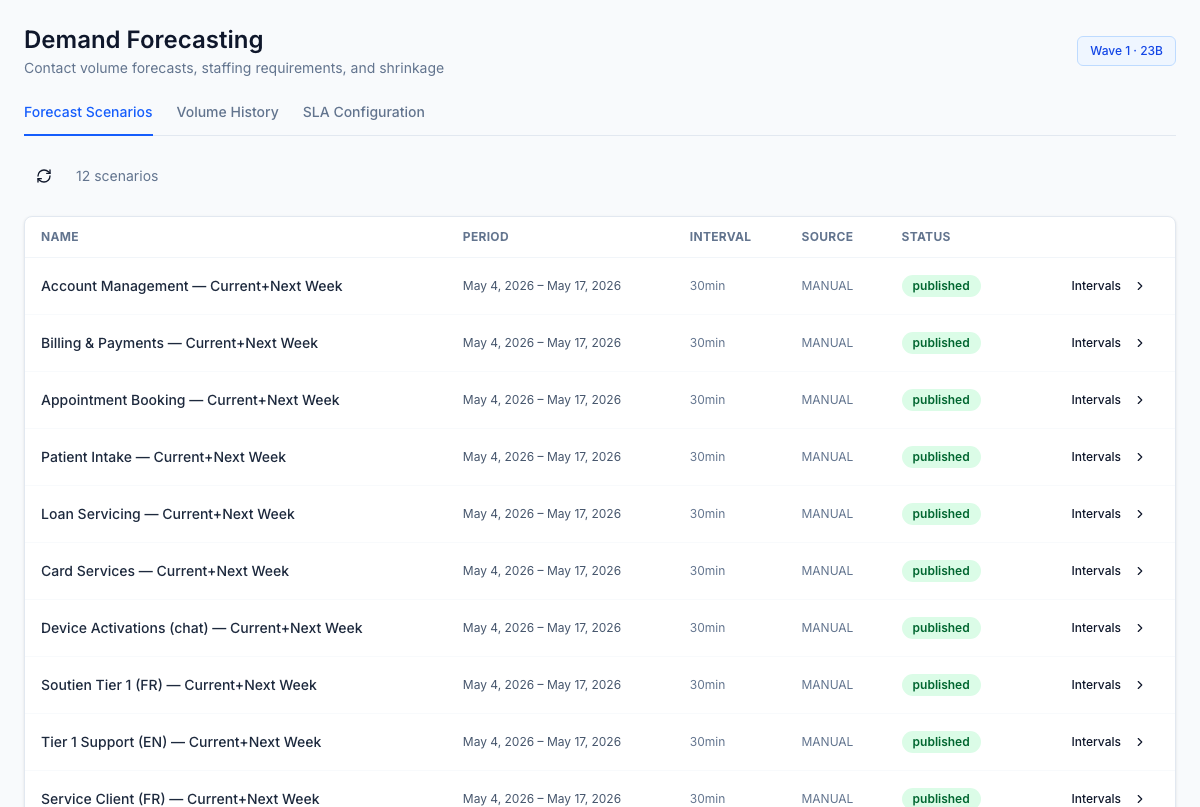
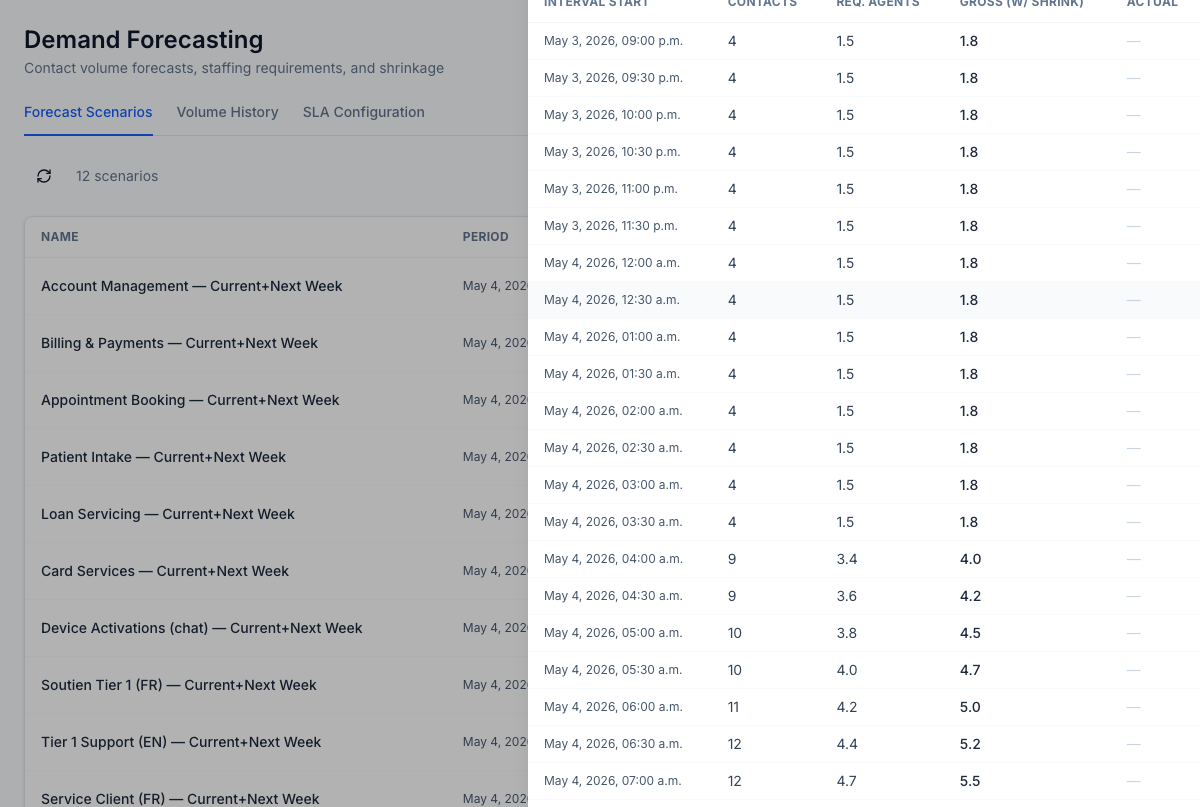
Forecast scenarios per LOB — published versions drive the schedule directly; new scenarios get drafted and tested before they affect roster generation.
1 / 2
For the operator
Upload or sync historical contact volume by LOB and interval, set your target service level and AHT (Average Handle Time: the mean duration of a customer interaction.), and the model produces required headcount per interval for the upcoming roster period. The forecast hands directly to Schedule Optimization (23E) and Capacity Planning so you're not retyping numbers across three tools. Re-forecast mid-period when reality diverges and the downstream views update; you stop running the same Excel model month after month.
Business impact
Forecasting accuracy is the single highest-leverage variable in the contact centre P&L (Profit and loss: the statement of a business's revenue and costs.): a one-percent over-forecast burns straight margin, a one-percent under-forecast burns SLA (Service Level Agreement: a contractual performance target, e.g. answering X% of calls within Y seconds.) credits and client renewals. Replacing tribal-knowledge spreadsheets with a model that learns from outcomes pulls forecast variance toward the band where neither side of the trade hurts. The capacity planner you'd otherwise dedicate to weekly forecasting refresh cycles gets redeployed to the higher-margin work of demand sensing for new client wins.